TD SYNNEX (SNX)
TD SYNNEX is the world's largest IT distributor. They purchase inventory in bulk from vendors like Apple, Microsoft, HP, IBM, Cisco, Dell, and Lenovo. It warehouses that inventory across distribution centers worldwide. When a reseller needs products, SNX ships them.
Without a middleman, either manufactures tie up money in unsold goods or customers wait weeks for products to be produced. The distribution and logistics model acts as a shock absorber for the industry, allowing TD SYNNEX to sit in-between and absorb the mismatch. As a result, margins are thin and scale matters.
Background
TD SYNNEX is the result of a 2021 merger between Tech Data and SYNNEX.
In 2019, private-equity firm Apollo bid to acquire Tech Data for $130 per share. Berkshire Hathaway – after Buffett had Greg Abel visit Tech Data's headquarters in Florida – bid $140. Apollo raised their bid to $145 and won. The deal closed June 2020. In March 2021, Apollo merged Tech Data with SYNNEX Corp.
One risk to point out up front is there's a number of comments on reddit et al. about how much worse SNX service has been since the two companies merged. Tech Data was great. But, since merging, TD SYNNEX is not.
I don't know how to weight that except to acknowledge it exists. It's clearly not stopping business.
As an aside, if you go look at the old financials, it doesn't take long to see why Buffett would have preferred to acquire Tech Data. A scavenger hunt if you're bored.
Also, if you're reading this in email or on your phone, you may have a better experience with the tables in this article if you view it on the computer.
Anyway.
Business
TD SYNNEX offers over 200,000 SKU's through about 2,500 vendors. They also work with customers to design customized server infrastructure through Hyve Solutions – in most cases building products within 3.5 days around the globe.
If you look at the company, you'll see gross billings and net revenue. The former was $89B in FY25, the latter $62.5B. The gap is primarily software, cloud and Hyve services where SNX acts as agent rather than principal. As software mix grows, the gap has increased. So, gross billings reflect actual transaction volume.
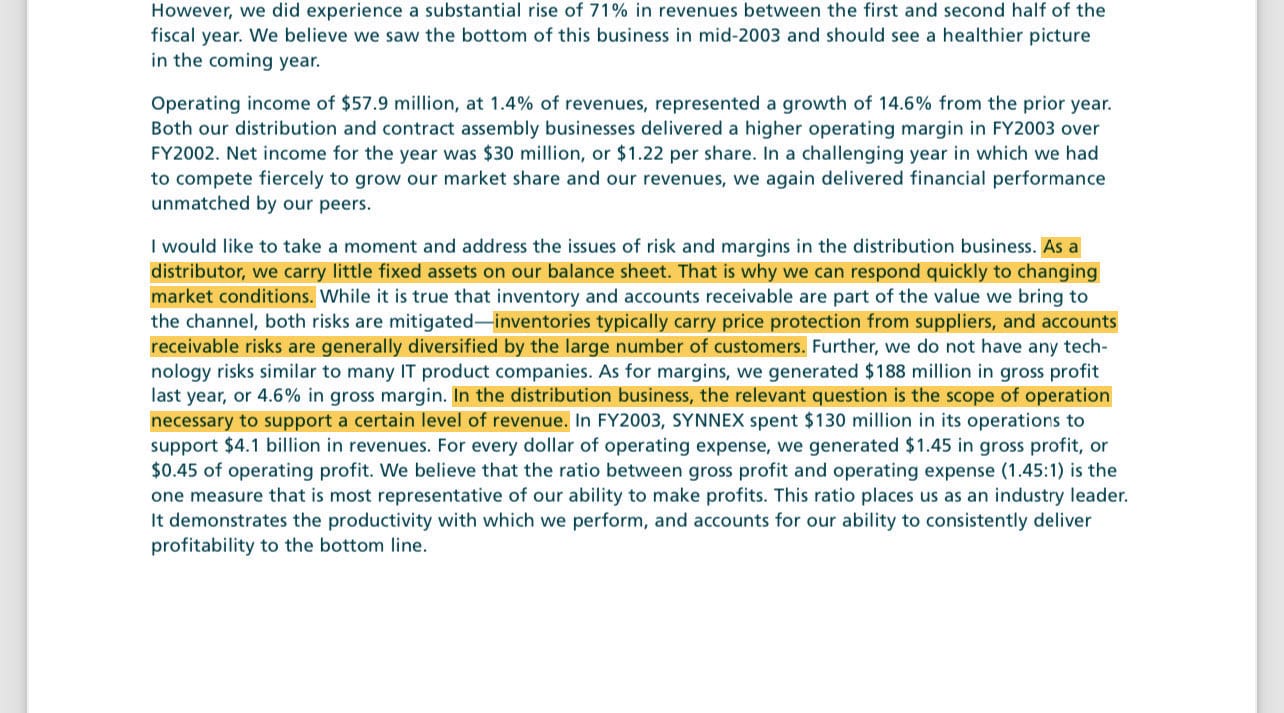
If you review either legacy businesses financials during the great financial crisis, you'd hardly know there had been one.
Tech Data Corporation
Consolidated Statement of Cash Flows (In thousands)
| Fiscal Year Ending Jan 31 | 2012 | 2011 | 2010 | 2009 | 2008 | 2007 | 2006 |
|---|---|---|---|---|---|---|---|
| Operating Activities | |||||||
| Cash received from customers | 26,435,178 | 24,258,805 | 21,927,372 | 23,989,567 | 23,473,295 | 21,185,902 | 20,504,871 |
| Cash paid to vendors/employees | (25,827,475) | (24,008,367) | (21,320,637) | (23,636,388) | (23,053,048) | (21,091,764) | (20,160,865) |
| Interest paid, net | (18,313) | (15,927) | (14,015) | (20,382) | (14,273) | (26,910) | (21,082) |
| Income taxes paid | (85,978) | (73,211) | (48,790) | (52,987) | (48,552) | (81,216) | (65,485) |
| Net cash from operating activities | 503,412 | 161,300 | 543,930 | 279,810 | 357,422 | (13,988) | 257,439 |
| Investing Activities | |||||||
| Acquisitions, net of cash acquired | (24,898) | (141,138) | (8,153) | (78,266) | (21,503) | — | — |
| Proceeds from sale of business | — | — | — | 7,161 | 16,500 | — | — |
| Proceeds from sale of property/eq. | — | — | 5,491 | — | — | 3,563 | 9,169 |
| Expenditures for property and eq. | (13,385) | (18,614) | (14,486) | (17,272) | (21,474) | (31,667) | (41,973) |
| Software development costs | (30,985) | (13,288) | (14,379) | (15,275) | (16,885) | (12,062) | (18,779) |
| Net cash used in investing activities | (69,268) | (173,040) | (31,527) | (110,813) | (52,701) | (23,666) | (51,583) |
*Values in parentheses indicate cash outflows.
The business is countercyclical, shrinking the balance sheet by selling down inventory (generating cash) during economic distress and growing it (spending cash) during good times.
The variable cost structure is what allows a company like SNX to absorb economic shocks.
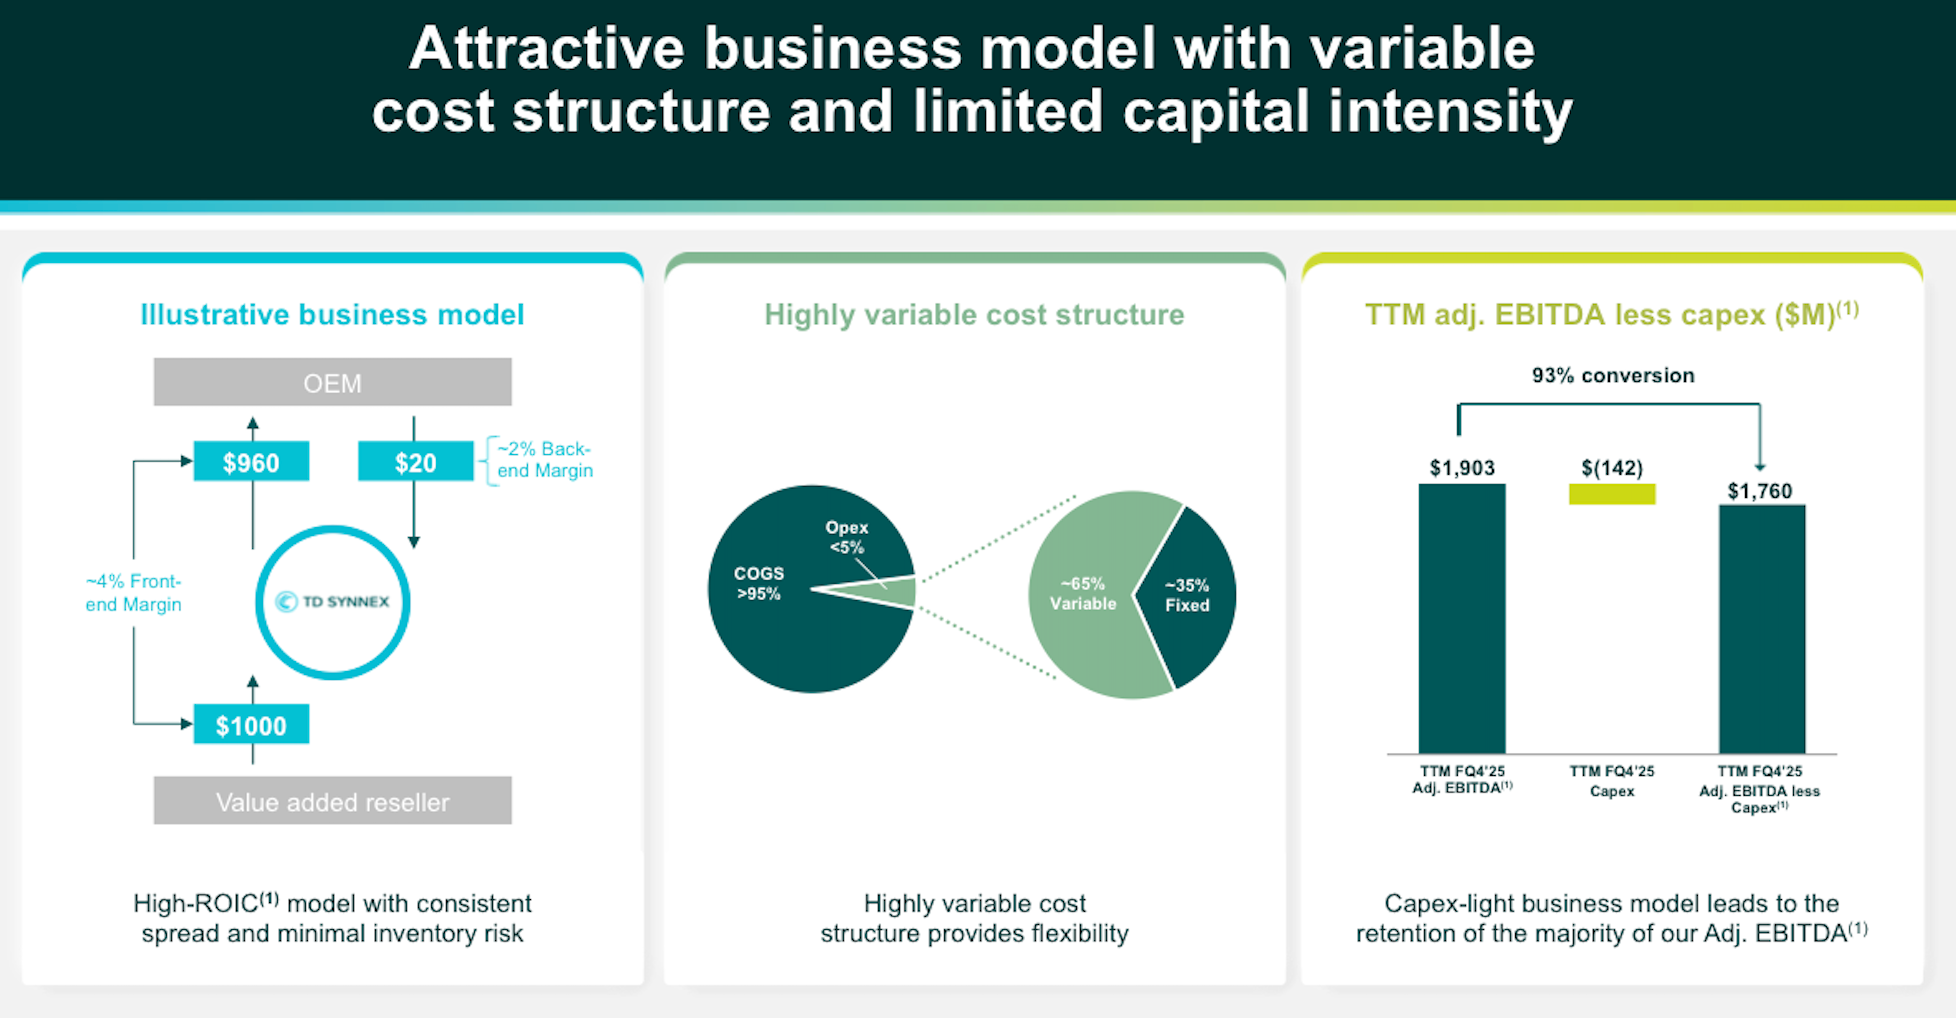
Manufacturers run most efficiently at a steady output, but demand can be sporadic. Without a company like SNX, either the manufacturer builds warehouse capacity and ties up capital in unsold goods, or the customer waits while products are manufactured to order. Neither is preferable for the two parties.
For a small fee (ie thin margin) SNX is willing to take one for the team and sit between these two parties and hold the buffer stock.
TD SYNNEX holds some inventory risk — but not all of it.
Vendor agreements can include price protection and stock rotation rights. Price protection means that if a vendor drops prices, the distributor receives credits on inventory already purchased at higher cost. Stock rotation allows the distributor to return some percentage of low turnover inventory to the vendor. These provisions limit some obsolescence risk for distributors.
Still, the distributor carries risk. When demand falls, they cannot return all excess inventory and book write-downs.
Margins & Returns
Although SNX earns thin profit margins (6-7% gross; 2% operating; 1.3% net), they earn ~25% return on tangible assets and 10% ROIC.
For FYE 2025, they earned $1.4B NOPAT on $5.8B of tangible assets – 75% of which consists of working capital.
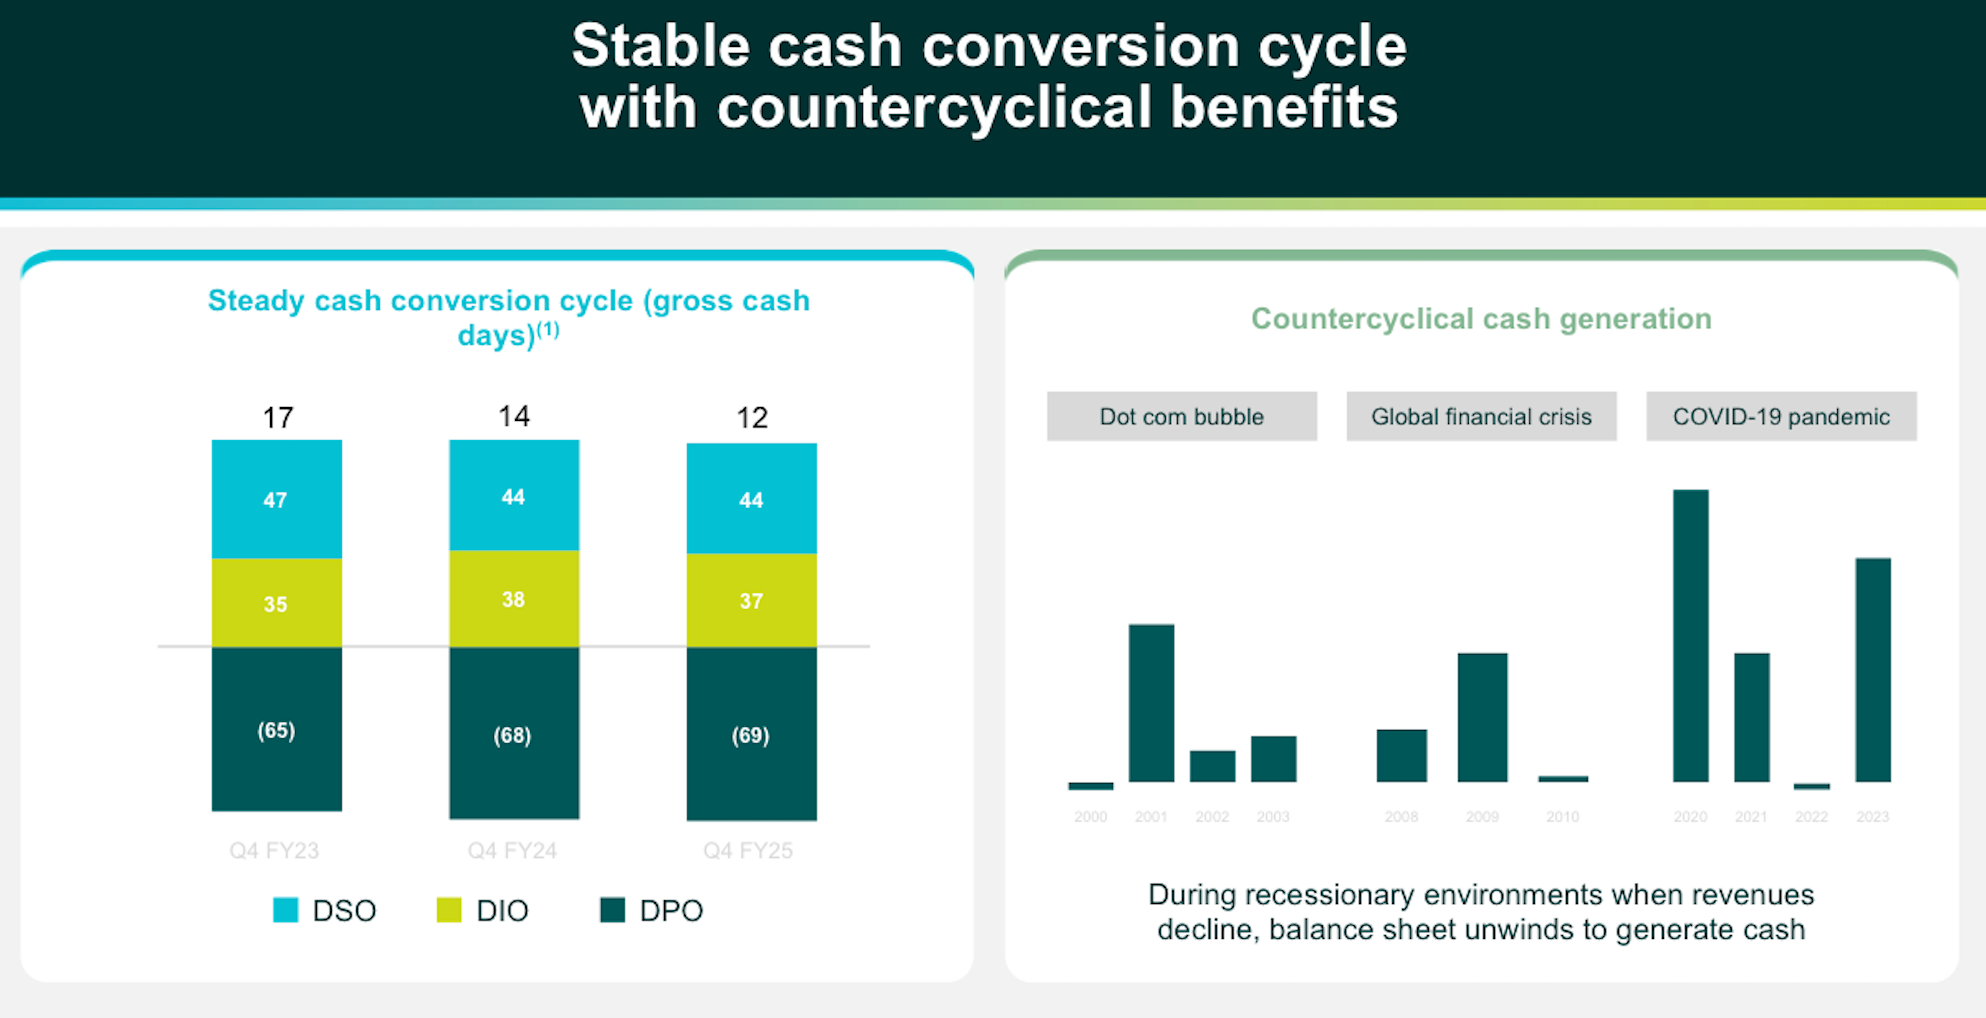
SNX's cash conversion cycle runs about 16-23 days — meaning the company finances roughly three weeks of inventory and receivables on its balance sheet at any given time. At over $62 billion in annual revenue, that's about $4 billion in working capital tied up in the business.
When demand increases, working capital expands to hold more inventory. When demand contracts, working capital shrinks — but not immediately, so the company gets stuck holding excess stock.
Cash flow generally follows a seasonal pattern of consuming cash in the first half of the year and generating it in the second half. Q4 is strongest which creates large receivables that collect in Q1 while inventory builds and payables come due.
The distribution business is like working capital arbitrage. SNX borrows at investment-grade rates, uses that capital to finance inventory and receivables, and earns thin margins on the spread.
Capital Allocation
Since the merger, SNX has bought back 15% of its shares (95.5 million to 80.9 million). They've returned over $2.2 billion to shareholders through dividends and repurchases FY23-25. Current market cap is around $13 billion.
Hyve
Hyve Solutions is different from the rest of TD SYNNEX.
Hyve designs and builds custom server infrastructure for hyperscale datacenter operators — Amazon, Google, Meta, Microsoft etc. These customers specify exactly what they want, then Hyve builds it.
Hyve gross billings grew over 50% year-over-year in Q4 fiscal 2025.
Management has described Hyve margins as "accretive" with returns exceeding cost of capital. However, Hyve margins run below the distribution average so a shift in mix toward Hyve can bring down overall company gross margins even as operating profit grows.
In fiscal 2024, management noted that elevated margins from prior-year cost recoveries did not repeat, creating a headwind. Working capital requirements for Hyve are substantial given the long production cycles and large order sizes.
Customer concentration is high, and losing a major account would materially impact results.
So what?
TD SYNNEX is sitting in the middle of an infrastructure buildout.
The five largest hyperscalers — Amazon, Microsoft, Alphabet, Meta, and Oracle — are projected to spend over $600 billion on capital expenditures in 2026. About 75% of this spending, targets AI infrastructure: GPUs, servers, networking, data centers, and supporting equipment.
Goldman Sachs projects hyperscalers' capex to triple to $1.4T by 2027. Capital intensity (capex as a percent of revenue) has reached 45-57% at some hyperscalers.
But technology infrastructure booms have ended before.
Fiber optic spending from 1998-2001 collapsed when the dot-com bubble burst, and left equipment vendors stuck with capacity and worthless inventory. Networking equipment spending crashed in 2001-2002. Server spending fell in 2008-2009 during the financial crisis.
Tech Data and SYNNEX both survived — distribution businesses are more resilient than equipment manufacturers because they don't carry the fixed costs of factory capacity. But, that doesn't mean revenue can't fall or the stock won't decline.
SNX's shock absorption works both ways. It buffers customers and vendors during expansions, but absorbs the first impacts of contraction through inventory write-downs and working capital compression.
Valuation
I've been watching this company for about two years now. My estimate for their normalized free cash flow generation has been $950 million. FY25 FCF was $1.4 billion. FY24 was $1 billion. FY23 was $1.3 billion.
It's possible I'm too conservative. It's possible they're over earning. A couple years ago they were targeting $1.5B+ FCF as a "medium-term target."
I'll round up and say $1B normalized free cash flow, $2.2B net debt, 80.9 million shares outstanding. Current market cap is $12.9B.
I don't mind purchasing some shares below $170. I think the company could be worth $230 per share if AI capex doesn't collapse overnight. If it did, the stock could too (it fell ~35% in 6 weeks last year), but I think fundamentally it's worth at least $160 per share under fairly extreme environments. A lot of this business is not going away. But, there's cycles to everything.
I've purchased shares a couple times between $100-130. It's not currently a large position for me but it's a company I follow closely and take advantage of volatility.
TD SYNNEX Corporation
Quarterly Financial Data (In millions, except per share and ratios)
| Fiscal Year Ending Nov 30 | Q4 21 | Q1 22 | Q2 22 | Q3 22 | Q4 22 | Q1 23 | Q2 23 | Q3 23 | Q4 23 | Q1 24 | Q2 24 | Q3 24 | Q4 24 | Q1 25 | Q2 25 | Q3 25 | Q4 25 |
|---|---|---|---|---|---|---|---|---|---|---|---|---|---|---|---|---|---|
| Income Statement | |||||||||||||||||
| Revenue | 15,611 | 15,470 | 15,270 | 15,356 | 16,248 | 15,125 | 14,062 | 13,961 | 14,407 | 13,975 | 13,948 | 14,685 | 15,845 | 14,532 | 14,946 | 15,651 | 17,379 |
| Gross profit | 943 | 969 | 956 | 916 | 1,060 | 1,004 | 963 | 971 | 1,019 | 1,006 | 974 | 961 | 1,041 | 998 | 1,046 | 1,130 | 1,195 |
| Gross margin | 6.0% | 6.3% | 6.3% | 6.0% | 6.5% | 6.6% | 6.9% | 7.0% | 7.1% | 7.2% | 7.0% | 6.5% | 6.6% | 6.9% | 7.0% | 7.2% | 6.9% |
| SG&A expenses | (656) | (653) | (671) | (628) | (676) | (654) | (674) | (659) | (685) | (672) | (672) | (658) | (715) | (692) | (718) | (744) | (793) |
| Acquisition & restructuring | (102) | (93) | (32) | (46) | (50) | (51) | (37) | (72) | (47) | (32) | (38) | (1) | (1) | (1) | (1) | (2) | (3) |
| Operating income | 185 | 222 | 253 | 242 | 334 | 298 | 253 | 240 | 287 | 303 | 264 | 303 | 325 | 304 | 328 | 384 | 399 |
| Operating margin | 1.2% | 1.4% | 1.7% | 1.6% | 2.1% | 2.0% | 1.8% | 1.7% | 2.0% | 2.2% | 1.9% | 2.1% | 2.1% | 2.1% | 2.2% | 2.5% | 2.3% |
| Net income | 119 | 132 | 149 | 149 | 221 | 167 | 133 | 139 | 188 | 172 | 144 | 179 | 195 | 168 | 185 | 227 | 248 |
| Diluted EPS | $1.24 | $1.37 | $1.55 | $1.55 | $2.31 | $1.75 | $1.41 | $1.49 | $2.06 | $1.93 | $1.67 | $2.10 | $2.30 | $2.00 | $2.23 | $2.77 | $3.07 |
| Diluted shares (M) | 95.9 | 95.9 | 95.7 | 95.4 | 95.1 | 94.5 | 93.6 | 92.9 | 90.4 | 88.2 | 85.9 | 84.9 | 84.5 | 84.0 | 82.9 | 81.9 | 80.9 |
| Cash Flow | |||||||||||||||||
| Operating cash flow | 561 | (1,320) | 1,036 | (67) | 302 | (103) | 708 | 592 | 211 | 385 | (115) | 386 | 562 | (748) | 573 | 246 | 1,460 |
| Share repurchases | — | (24) | (29) | (30) | (42) | (115) | (60) | (103) | (343) | (199) | (254) | (57) | (102) | (101) | (149) | (174) | (173) |
| Dividends paid | (19) | (29) | (29) | (29) | (29) | (33) | (33) | (33) | (31) | (36) | (34) | (34) | (34) | (37) | (37) | (36) | (36) |
| Balance Sheet | |||||||||||||||||
| Cash | 994 | 510 | 522 | 351 | 523 | 539 | 852 | 1,251 | 1,034 | 1,031 | 1,174 | 854 | 1,059 | 542 | 767 | 874 | 2,435 |
| Accounts receivable | 8,310 | 8,732 | 7,852 | 8,114 | 9,421 | 9,357 | 8,376 | 8,892 | 10,298 | 8,903 | 8,853 | 10,032 | 10,342 | 9,424 | 10,128 | 10,925 | 11,708 |
| Inventories | 6,643 | 7,748 | 8,434 | 9,755 | 9,067 | 8,373 | 7,797 | 7,462 | 7,146 | 7,091 | 7,098 | 7,674 | 8,287 | 8,360 | 8,656 | 9,138 | 9,504 |
| Accounts payable | 12,035 | 12,058 | 12,521 | 13,719 | 13,989 | 12,998 | 12,135 | 12,485 | 13,347 | 12,373 | 12,135 | 13,873 | 15,084 | 13,037 | 14,543 | 15,651 | 17,624 |
| Working capital | 3,501 | 3,742 | 3,876 | 3,952 | 4,072 | 4,175 | 4,308 | 3,636 | 3,346 | 3,326 | 3,881 | 4,067 | 4,103 | 4,225 | 4,370 | 3,697 | 4,329 |
| Total debt | 4,136 | 5,047 | 4,111 | 4,134 | 4,104 | 4,389 | 4,105 | 4,079 | 4,083 | 4,009 | 4,596 | 4,050 | 3,907 | 4,328 | 4,106 | 4,239 | 4,610 |
| Stockholders' equity | 7,906 | 8,022 | 7,982 | 7,772 | 8,026 | 8,149 | 8,269 | 8,368 | 8,183 | 8,102 | 7,956 | 8,164 | 8,035 | 8,050 | 8,342 | 8,454 | 8,450 |
| Key Metrics | |||||||||||||||||
| Days sales outstanding | 48 | 51 | 47 | 49 | 53 | 56 | 55 | 59 | 65 | 58 | 59 | 63 | 60 | 58 | 62 | 64 | 61 |
| Days inventory outstanding | 41 | 48 | 54 | 62 | 54 | 53 | 54 | 53 | 49 | 50 | 50 | 51 | 51 | 56 | 57 | 58 | 53 |
| Days payable outstanding | 75 | 75 | 80 | 88 | 84 | 83 | 85 | 89 | 91 | 87 | 86 | 93 | 93 | 87 | 96 | 99 | 98 |
| Cash conversion cycle | 14 | 24 | 21 | 23 | 23 | 26 | 24 | 23 | 23 | 21 | 23 | 21 | 18 | 27 | 23 | 23 | 16 |
| Adjusted ROIC | 16% | 14% | 13% | 12% | 11% | 11% | 11% | 11% | 10% | 10% | 10% | 10% | 10% | 10% | 10% | 10% | 10% |
| Return on tangible assets | 16% | 20% | 23% | 26% | 27% | 27% | 26% | 29% | 30% | 30% | 26% | 25% | 24% | 23% | 22% | 26% | 24% |
| Trailing Twelve Months | |||||||||||||||||
| TTM Revenue | — | — | — | 61,707 | 62,344 | 61,999 | 60,792 | 59,396 | 57,555 | 56,405 | 56,291 | 57,015 | 58,452 | 59,009 | 60,007 | 60,974 | 62,508 |
| TTM Operating income | — | — | — | 902 | 1,051 | 1,127 | 1,127 | 1,125 | 1,078 | 1,082 | 1,094 | 1,156 | 1,194 | 1,196 | 1,260 | 1,341 | 1,415 |
| TTM Operating margin | — | — | — | 1.5% | 1.7% | 1.8% | 1.9% | 1.9% | 1.9% | 1.9% | 1.9% | 2.0% | 2.0% | 2.0% | 2.1% | 2.2% | 2.3% |
| TTM Net income | — | — | — | 550 | 651 | 686 | 670 | 661 | 627 | 632 | 643 | 682 | 689 | 685 | 726 | 774 | 828 |
| TTM Diluted EPS | — | — | — | $5.71 | $6.78 | $7.16 | $7.02 | $6.96 | $6.71 | $6.89 | $7.15 | $7.76 | $8.01 | $8.07 | $8.63 | $9.30 | $10.06 |
| TTM Adj. EBITDA | — | — | — | 1,739 | 1,824 | 1,834 | 1,813 | 1,814 | 1,750 | 1,733 | 1,747 | 1,742 | 1,737 | 1,712 | 1,740 | 1,826 | 1,903 |
| TTM Repurchases | — | — | — | (83) | (125) | (216) | (247) | (320) | (621) | (705) | (899) | (853) | (612) | (513) | (408) | (525) | (596) |
*Values in parentheses indicate expenses or cash outflows. All figures in millions except per share data and ratios.
Summary
Numbers are fun. And there's certainly plenty of them you can look at in their earnings supplements. But, the bottom line for me is this is a business that provides a necessary service, with long term tailwinds, has a durable business model and is trading at a reasonable price.
I think they can compound conservatively at around 10% through a cycle, if not mid-to-high teens on more optimistic and shorter term basis. They earn 10% ROIC and are targeting 10-12%+ EPS over the medium term.
Since I'm less optimistic than many regarding the sustainability of AI capex, it won't be a large position (unless there's a large drawdown), but it is a small holding I think will do alright over time.
Member discussion